SSC Graph Chart Dhaka board 2016….SSC Graph Chart Dhaka board 2016…….
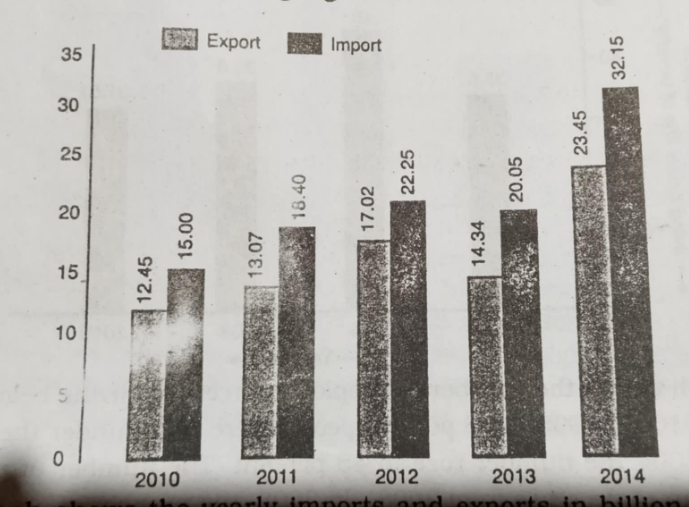
The graph shows the yearly imports and exports in billion dollars of a country from 2010 to 2015. In general, the graph shows the gradual rise of imports and exports of the country except in 2013. In 2010 the exports of the country were 12:45 billion dollars. On the otherhand , the imports were 15.00 billion dollars. But after a year in 2011, both the exports and imports of the country increased to 13:07 nd 18.40 billion dollars respectively.
they were .62 and 3.40 billion dollars higher respectively than the previous year. the exports and imports further increased in 2012 and the exports reached to 17.02 billion dollars and imports reached to 22.25 billion dollars. But we notice aa decrease in both the exports and imports of the country in 2013. The exports decreased to 14.34 billion dollars in 2013 which was 17.02 billion dollars in 2012. Similarly, the imports also decreased to 20.05 billion dollars in 2013 which was 22.25 billion dollars in 2012.
There is aa sharp raise in the exports and imports of the country in 2014 , The exports were 23.45 billion dollars in 2014 while the imports were 32.15 billion dollars. Overall, the graph illustrates that the lowest exports and imports were in 2010 which 12.45 and 15.00 billion dollars. Again, the exports and imports were highest in 2014 which were 23.45 and 32.15 billion dollars.
Read more Paragraph My favourite hobby
আমাদের ইউটিউব চ্যানেল ভিজিট করুন @dailystory0.5