Graph chart S.B Board 2016….Graph chart S.B Board 2016……Now I am write this graph….
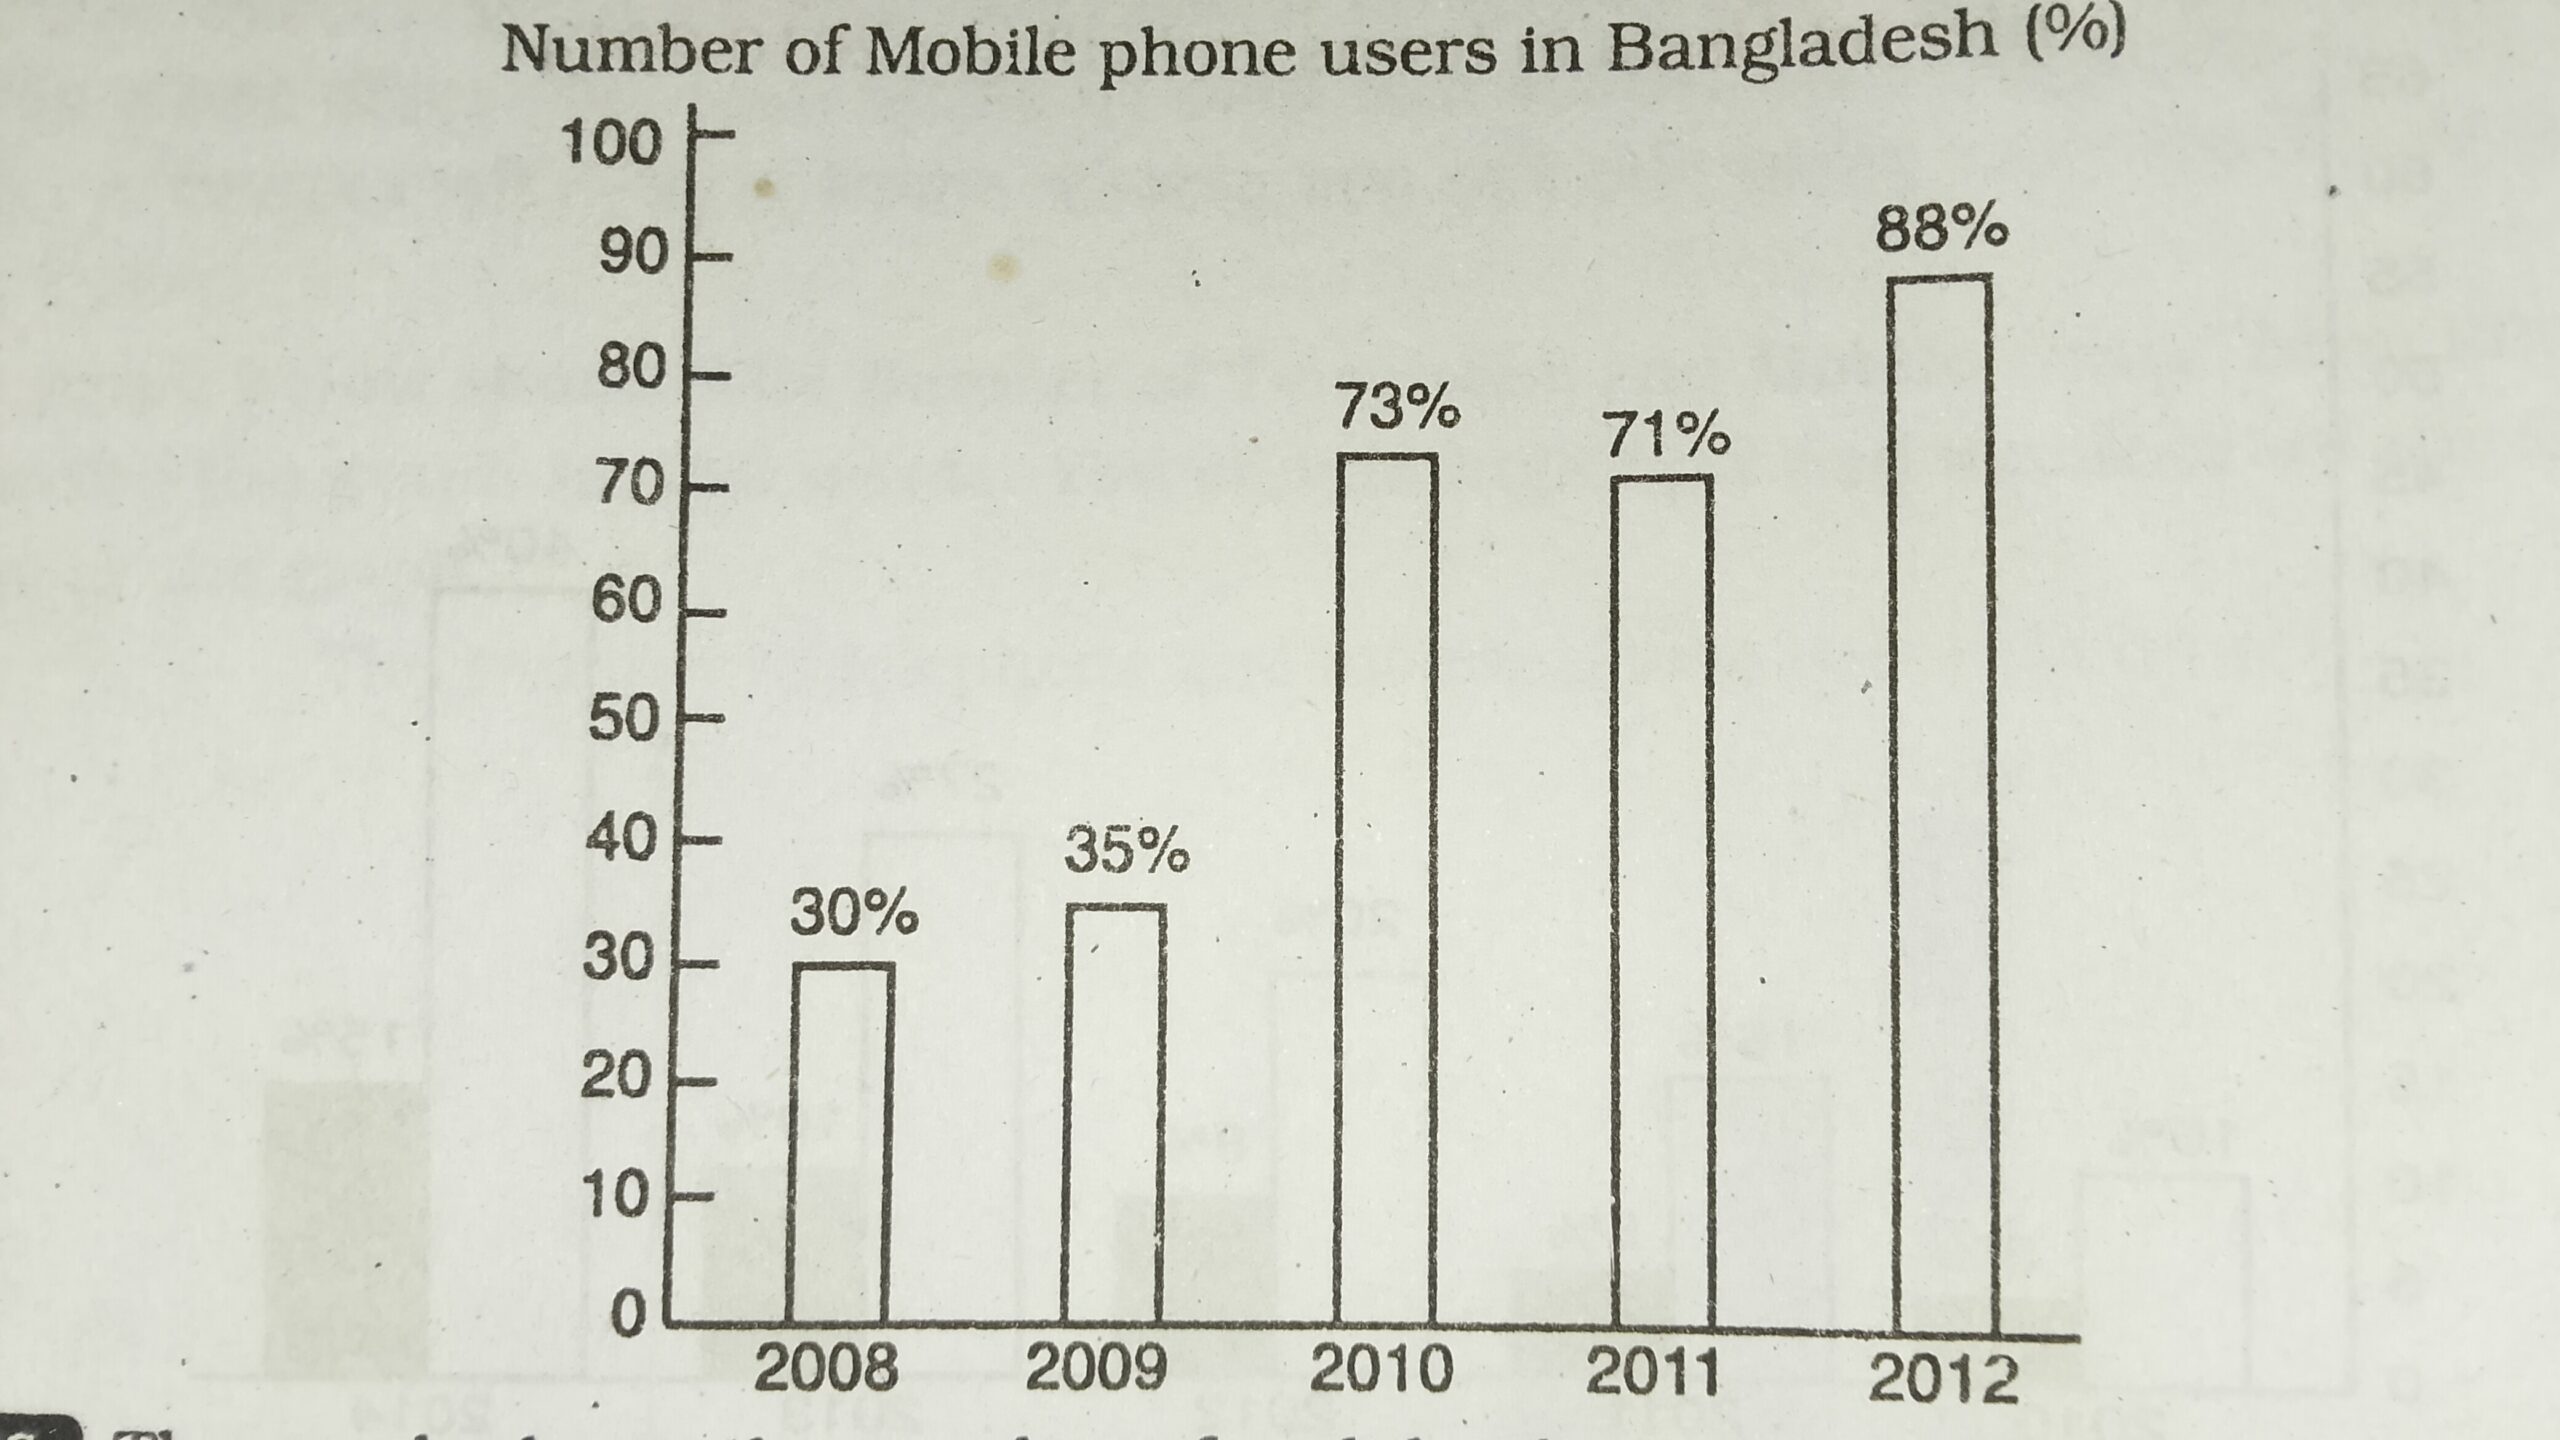
The graph shows the number of mobile phone users in Bangladesh from 2008 to 2012. In general the graph shows the gradual rise of mobile phone users within this time except in 2011. It is seen from the graph that the number of mobile phone users was 30% in 2008. The number reached to 35% in 2009. Thus the number increased by 5% from 2008 to 2009. There is a sudden rise in the number of mobile phone users in 2010. It become 73% in 2010 which was more than double than it was a year ago.
But we notice a fall in the number of mobile phone users in the next year. The percentage of mobile phone users come down to 71% in 2011. The rate was 73% in the previous year 2010. Again the number of mobile phone users increased remarkably within a year. In 2012 the number rose to 88% from 71% in 2011. So, we see that within a period of five years the number of mobile phone users in Bangladesh increased by almost three times than it was in 2008.
Overall, the graph illustrates that the highest number of mobile phone users was in 2012 and it was 88%. On the other hand, it was the lowest in 2008 which was 30%.
Read more Graph Chart Jashore Board 2016
visit our youtube @dailystory0.5