Graph Chart Jashore Board 2016…..Graph Chart Jashore Board 2016….. Now I am write this graph…….
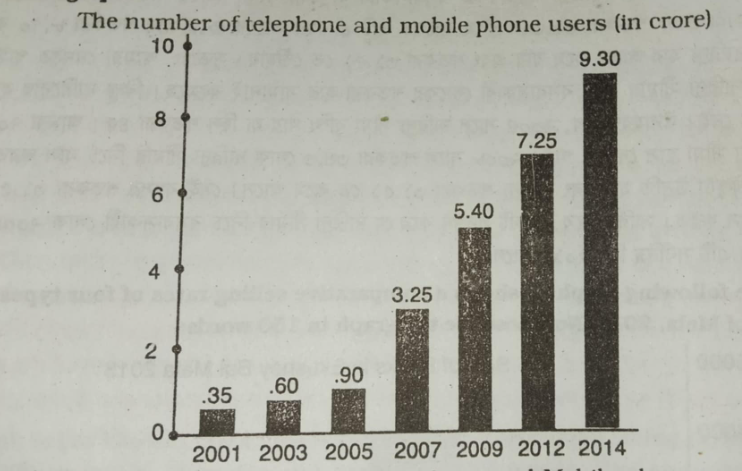
The graph shows the number of Telephone and mobile phone users 2001 to 2014. In shows the gradual raise in the number of Telephone and mobile phone users in the country withing this time. From the graph it is seen that in 2001. 35 crores of people used telephone and mobile phone. The number increased in 2003 and it reached to .60 crores.
The number countries to rise and it reached to .90 crores in 2005. There is a remarkable rise in the number of Telephone and mobile phone users. we notice a sudden rise in the number from 2007 to 2014. The number of Telephone and mobile phone users was 3.25, 5.40, 7.25 and 9.30 crores in the years 2007, 2009, 2012 and 2014 respectively.
The growth rate in the years 2007 to 2014 was higher than the years 2001 to 2005. Overall, the graph illustrates that the number of Telephone and mobile phone users is on the rise from 2001 to 2014. The highest number of Telephone and mobile phone users was in 2014 and it was 9.30 crores while the lowest number was in 2001 which was.35 crores.
Read more Paragraph My favourite hobby
visit YouTube channel @dailystory0.5