SSC Graph Chart C.B Board 2016……SSC Graph Chart C.B Board 2016……Now I am ✍️ write a graph…..
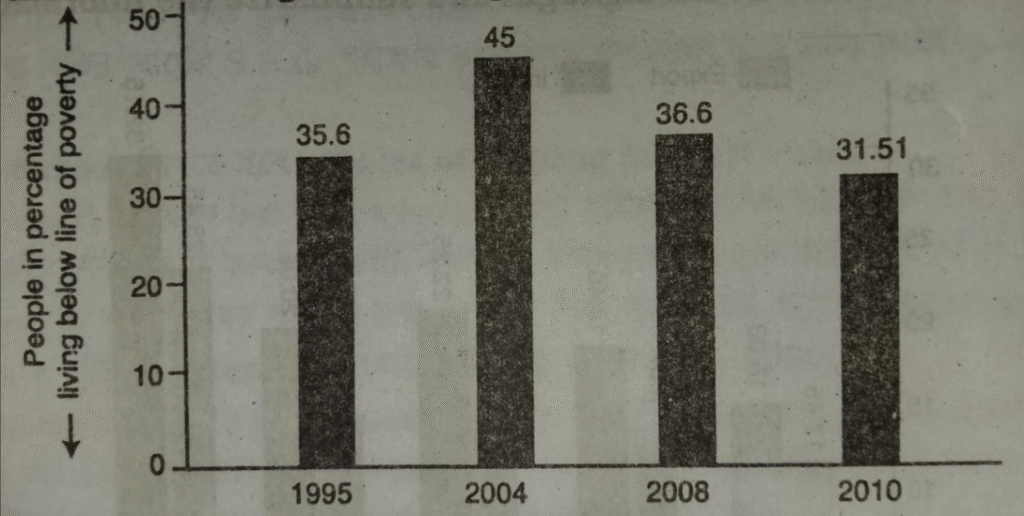
The graph shows the number of people in percentage living below the poverty line from 1995 to 2010. In 1995, 35.6 percent people were living under the poverty line. Nine years later, in 2004 the number rose to 45 percent. The number of people living below poverty line began to decrease from 2008. In 2008 the number of the people living below the poverty line decreased to 36.3 percent. It was about 8.70 percent lower than that of four years ago.
Finally in 2010 provrty rate further decreased and it reached to 31.51 percent. So, we see that within the time of 15 years the percentage of the people living below the poverty line has slightly decreased. But there is no uniformity in the decrease of poverty rate. For example, poverty line increased in 2004 which was 45 percent.
we notice a gradual decrease of poverty line from 2008. In 2008 36.3 percent people lived below poverty line. But in 2010 the situation improved to some extent and poverty decreased to 31.51. In that year 31.51 percent people lived below poverty line. Overall, the graph illustrates that the number of people living below poverty line was highest in 2004 while it was lowest in 2010
Read more SSC Graph Chart Dhaka board 2016
আমাদের ইউটিউব চ্যানেল ভিজিট করুন @dailystory0.5